
Real Estate Market Update - Robina, Gold Coast QLD - JANUARY 2023
The property market in Robina has well and truly changed direction over the past 6 months, with the median property price for houses having moved down by $130,000 from $1,240,000 to $1,110,000 from June 2022 till November 2022.
The median price for apartments in Robina has remained fairly resilient, moving sideways from June 2022 to November 2022.
Supply - Demand
Supply on the Gold Coast and in Robina continues to remain surprisingly low. Even with the increase in days on market, which in itself should increase the number of properties on the market, the number of properties for sale has in fact reduced significantly over the past 2 months. The supply of apartments has remained consistently low by historical standards.
Demand has been dropping steadily with enquiry levels and attendance at open homes down significantly (see my summary below).
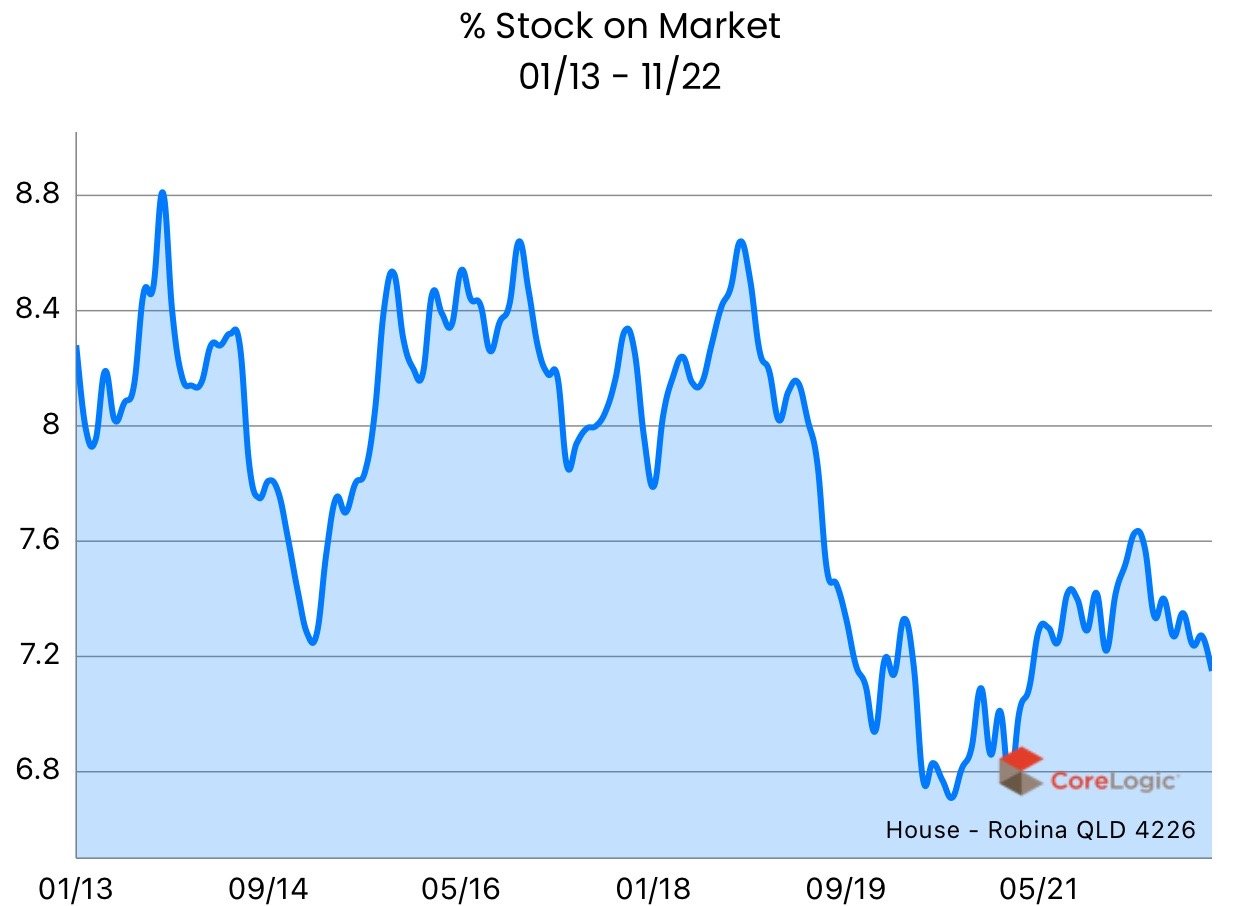
Below are the stock level graphs for houses and units in Robina and the Gold Coast.


Houses - Robina
The median value for houses in Robina has changed direction dramatically, after rising sharply for the past one and a half years.
The number of days on the market is rising as well, however, the stock levels have decreased recently after rising since the middle of 2022.


Units - Robina
The unit prices in Robina remain resilient against the prevailing market conditions and have moved sideways for the past 6 months.
Stock levels also remain low as do the days on market.


Summary
The Robina and Gold Coast property markets' growth phase has definitely come to an end for the time being. The increase in interest rates and inflation pressures have changed buyer sentiment and the ability for buyers to obtain loans and this is now being clearly seen in the decrease of property prices.
The average number of buyers through each of our open homes continues to decrease, down from 10 in February and March 2022, to 3 in December 2022. This is a very significant decrease in demand!
Below is a graph showing the average number of inspections per open home per month (for Ray White Robina), since July 2019. This graph represents the "demand" within the market.

Average inspections per open home within Ray White Robina office till February 2022