
Real Estate Market Update - Robina, Gold Coast QLD - JULY 2023
Much to the surprise of many, the property market has remained surprisingly strong on the Gold Coast. This is being driven mainly by the incredibly low stock levels and demand from buyers is still fairly robust.
We have seen a reverse in the decline of property prices in Robina, with both houses and units increasing in price over the past 3 to 5 months.
Supply and Demand
Supply on the Gold Coast and in Robina continues to remain incredibly low. Even with the increase in days on market, which in itself should increase the number of properties on the market, the number of properties for sale continues to reduce. This puts enormous upwards pressure on prices with buyers chasing fewer and fewer properties.
Demand has remained steady for the past 6 months and doesn't show any signs of slowing down for the moment. (see my summary below).
Below are the stock level graphs for houses and units in Robina and the Gold Coast.

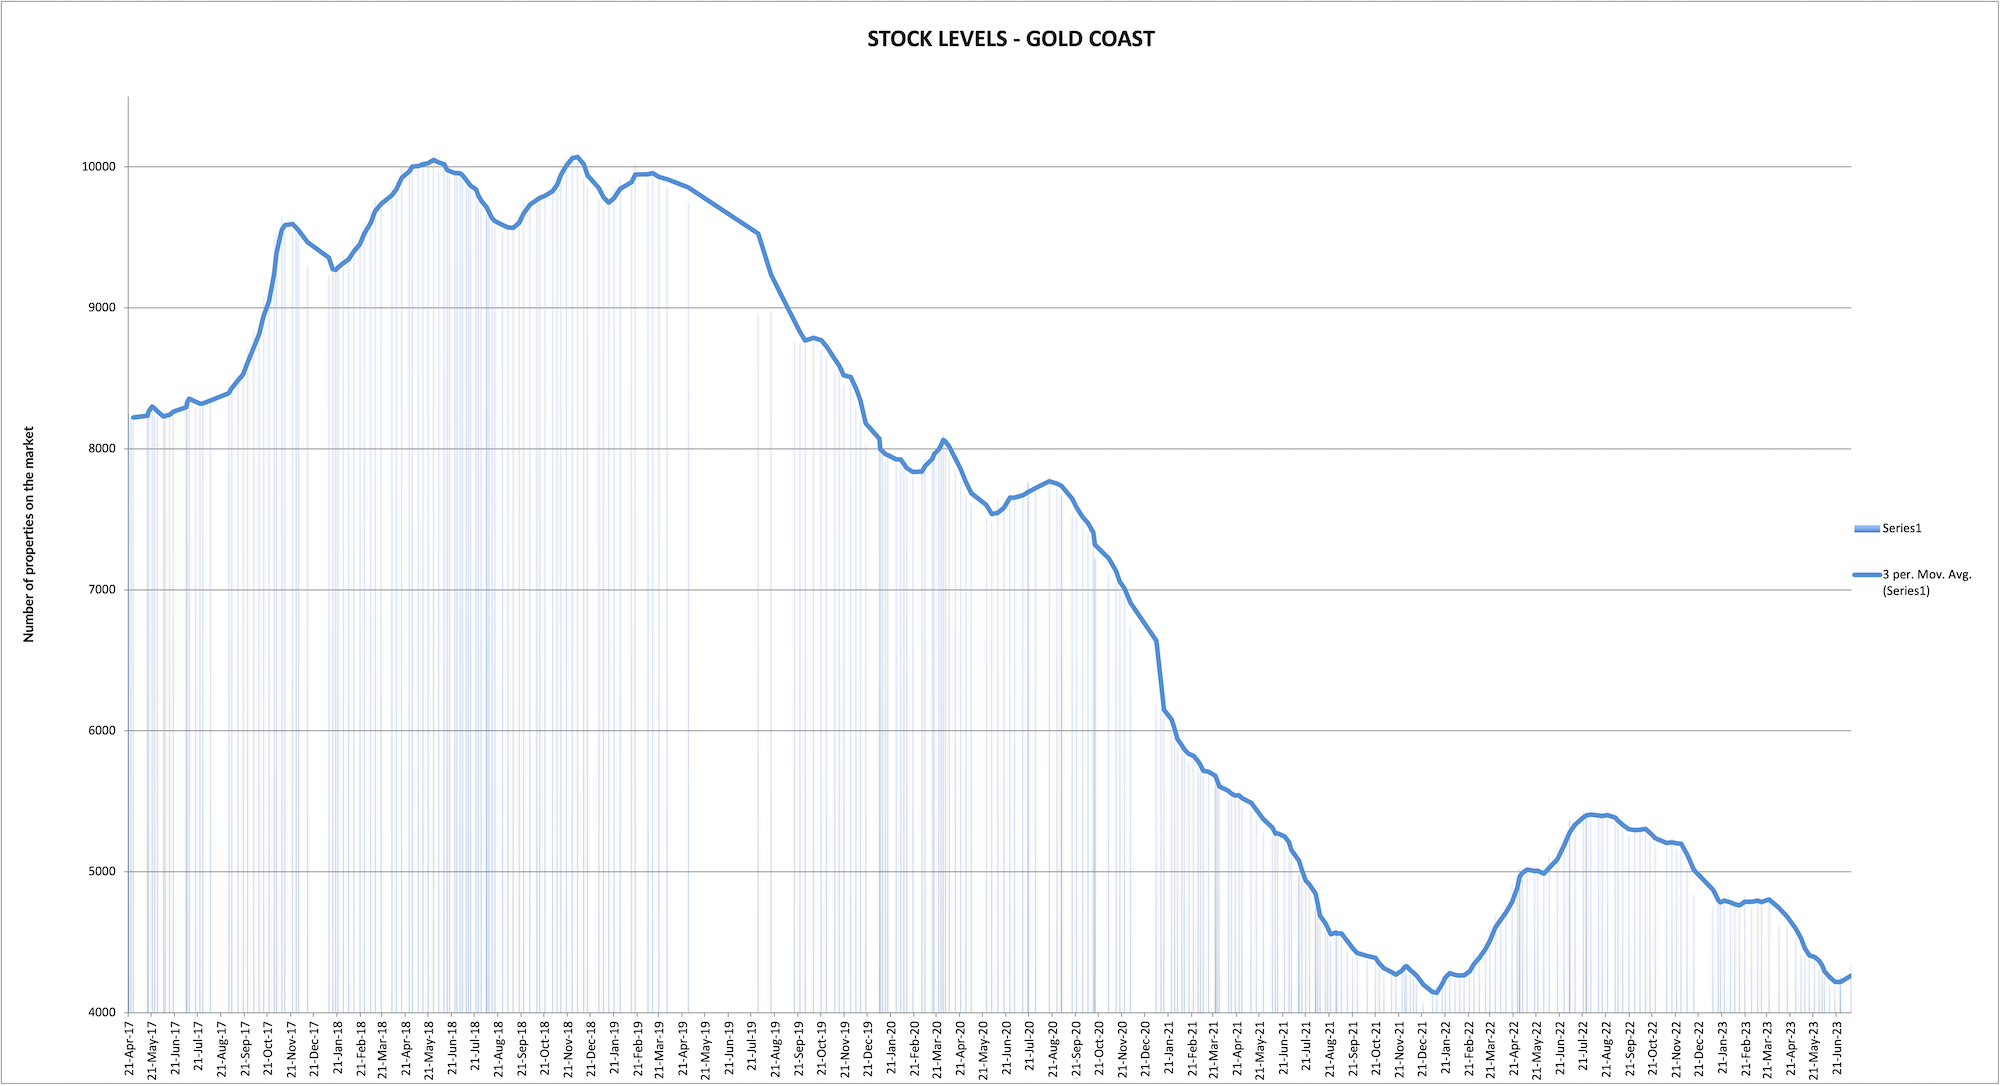
Houses - Robina
The median value for houses in Robina starting dropping in June 2022, and bottomed out in January 2023 and has been slowly increasing since then.
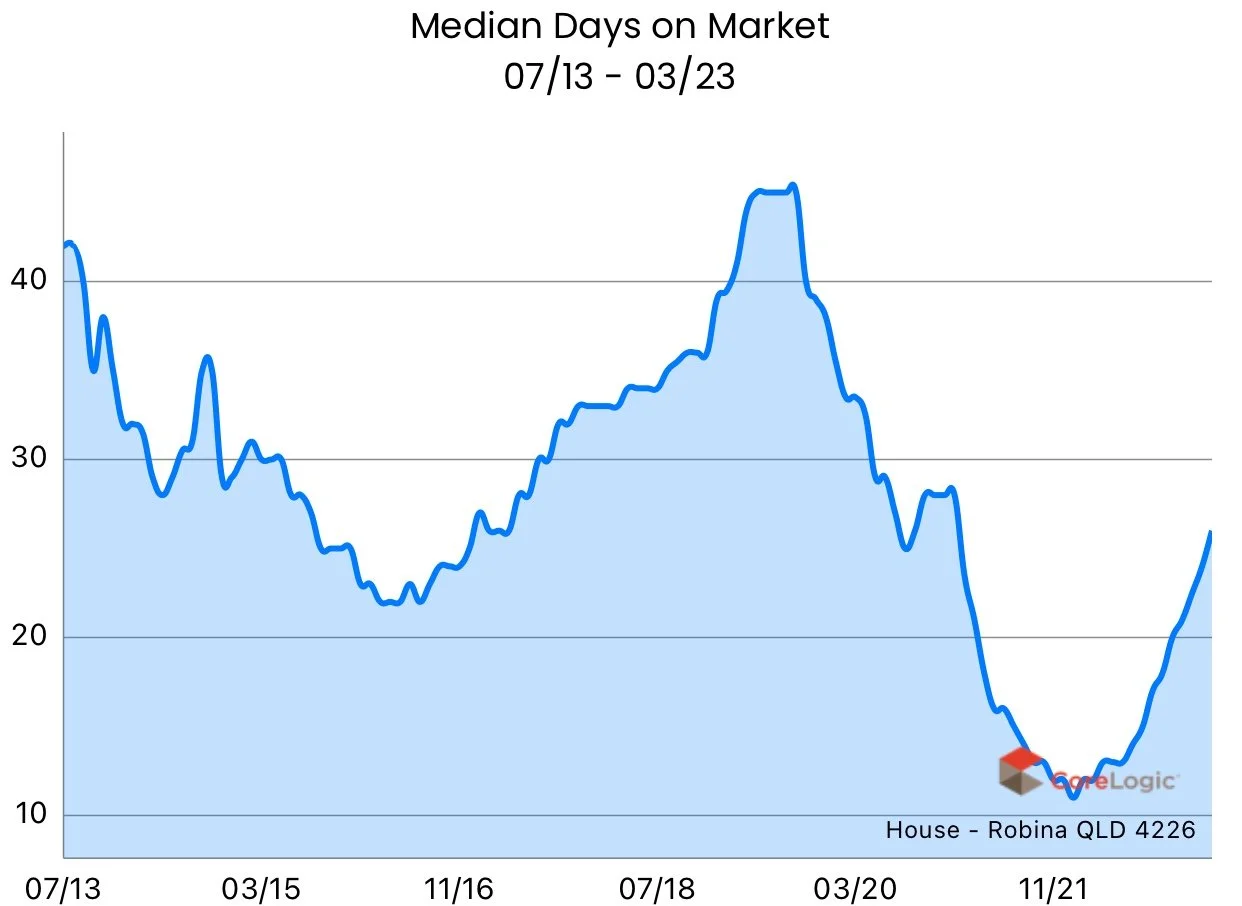
The number of days on the market has been steadily rising since December 2022, however, the stock levels have decreased significantly.


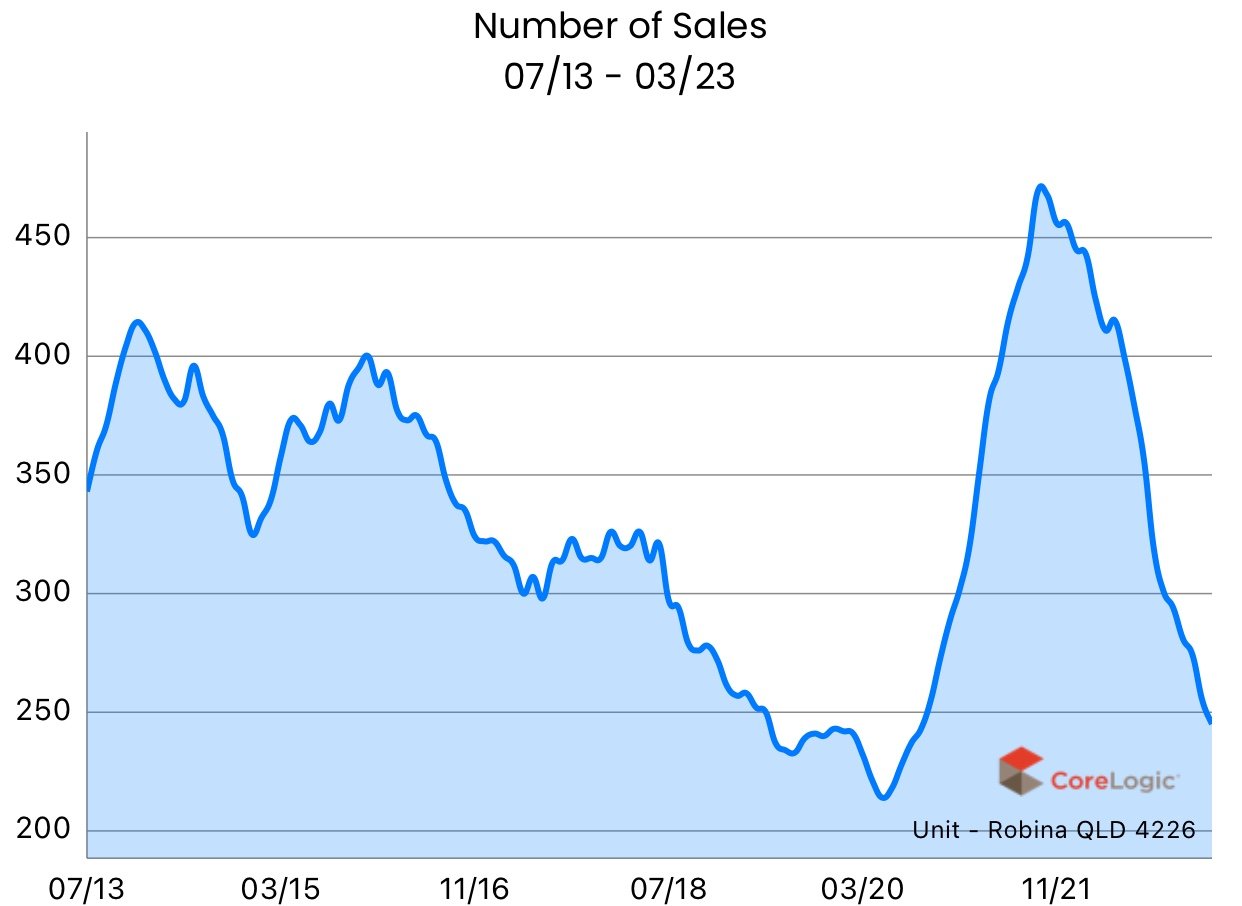
Units - Robina
The median value for units in Robina started dropping in October 2022, and bottomed out in February 2023 and has been slowly increasing since then.
The number of days on the market has remained low and stock levels are also very low and remaining at these low levels.


Summary
The Robina and Gold Coast property market has shown surprising resilience to the continuous interest rate increases. From my personal experience, this has been due to the significant number of buyers who are cashed up and not relying on obtaining loans. The low stock levels continue to maintain the status quo as most of the stock gets purchased by these cashed up buyers.
The average number of buyers through each of our open homes continues to remain steady at around 6 parties per open home. This is still higher than what one would consider a "normal" market prior to covid!
Below is a graph showing the average number of inspections per open home per month (for Ray White Robina), since July 2019. This graph represents the "demand" within the market.

Average inspections per open home within Ray White Robina office till June 2023