
Real Estate Market Update - Robina, Gold Coast QLD - March 2022
The property market on the Gold Coast has had an incredible year of growth in 2021, with stock levels having remained very low over the year and buyer demand seeming to be endless. The start to 2022 has been very strong, however, there are a few subtle indicators pointing to a possible slow down or levelling off in the market.
Supply - Demand
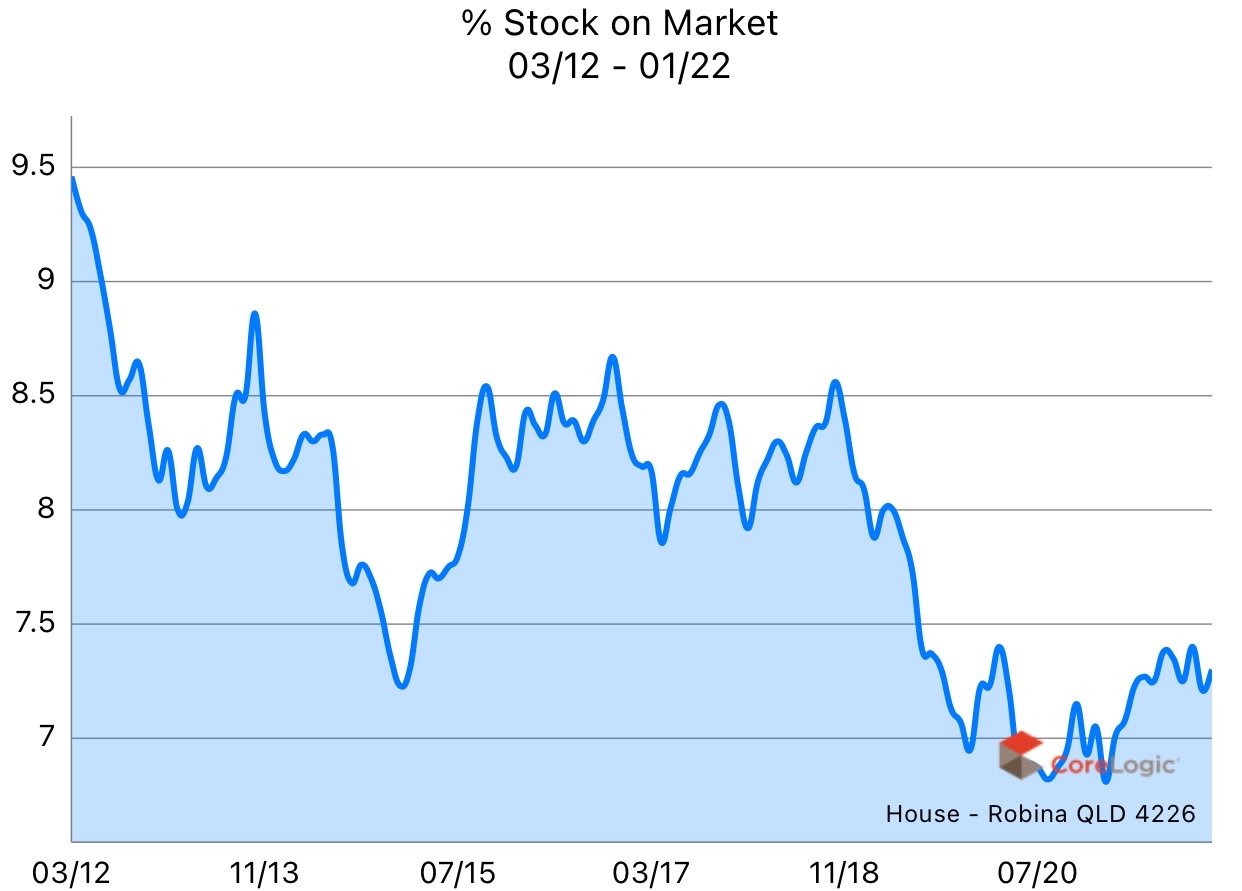
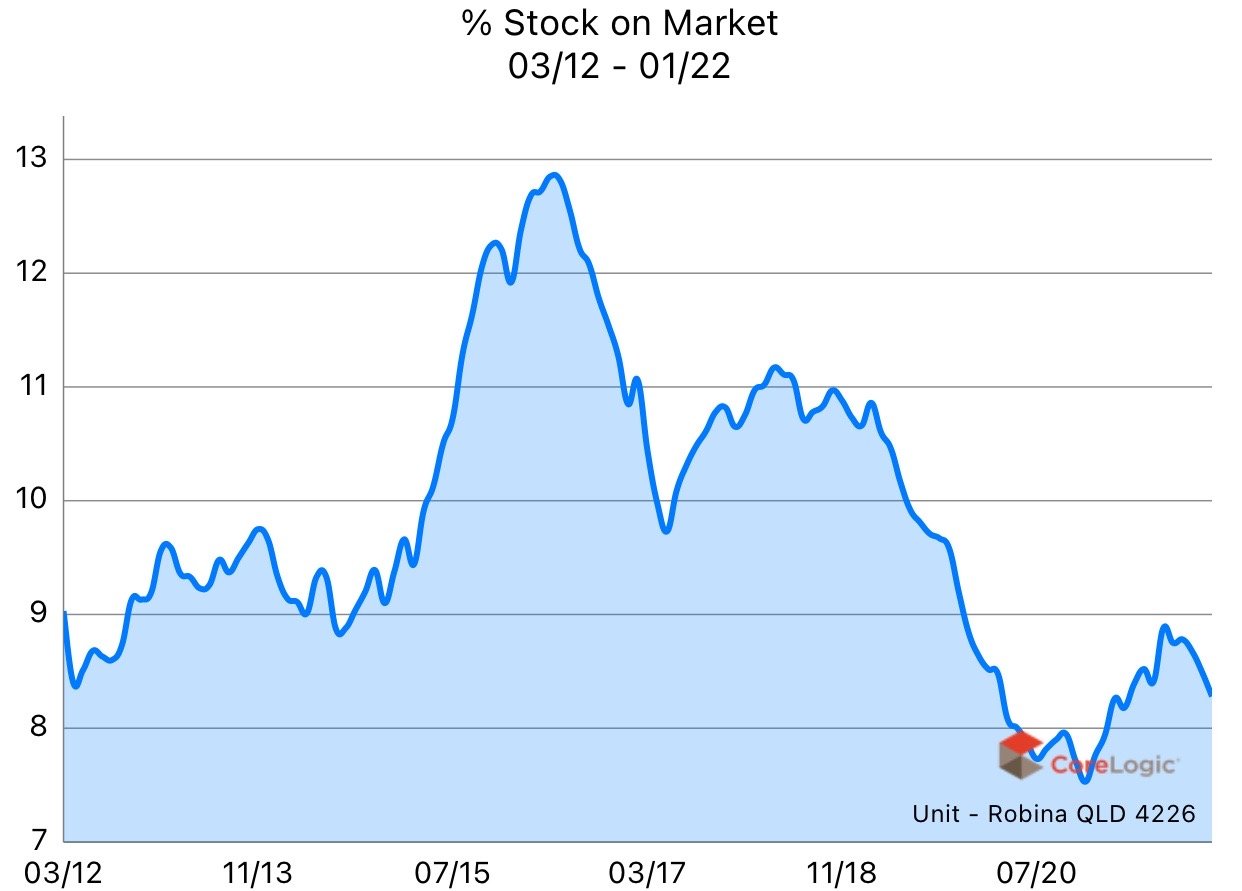
Supply on the Gold Coast and in Robina continues to be extremely low with a slight increase in stock levels of houses in Robina and in general across the Gold Coast. The low supply levels continues to support the high prices being achieved, however, the supply decline does seem to have bottomed out.
Demand remains strong, with very large numbers of enquiries for most properties brought to market and consistently large numbers through our open homes (see my summary at the end of the email).
Below are the stock level graphs for houses and units in Robina and the Gold Coast.
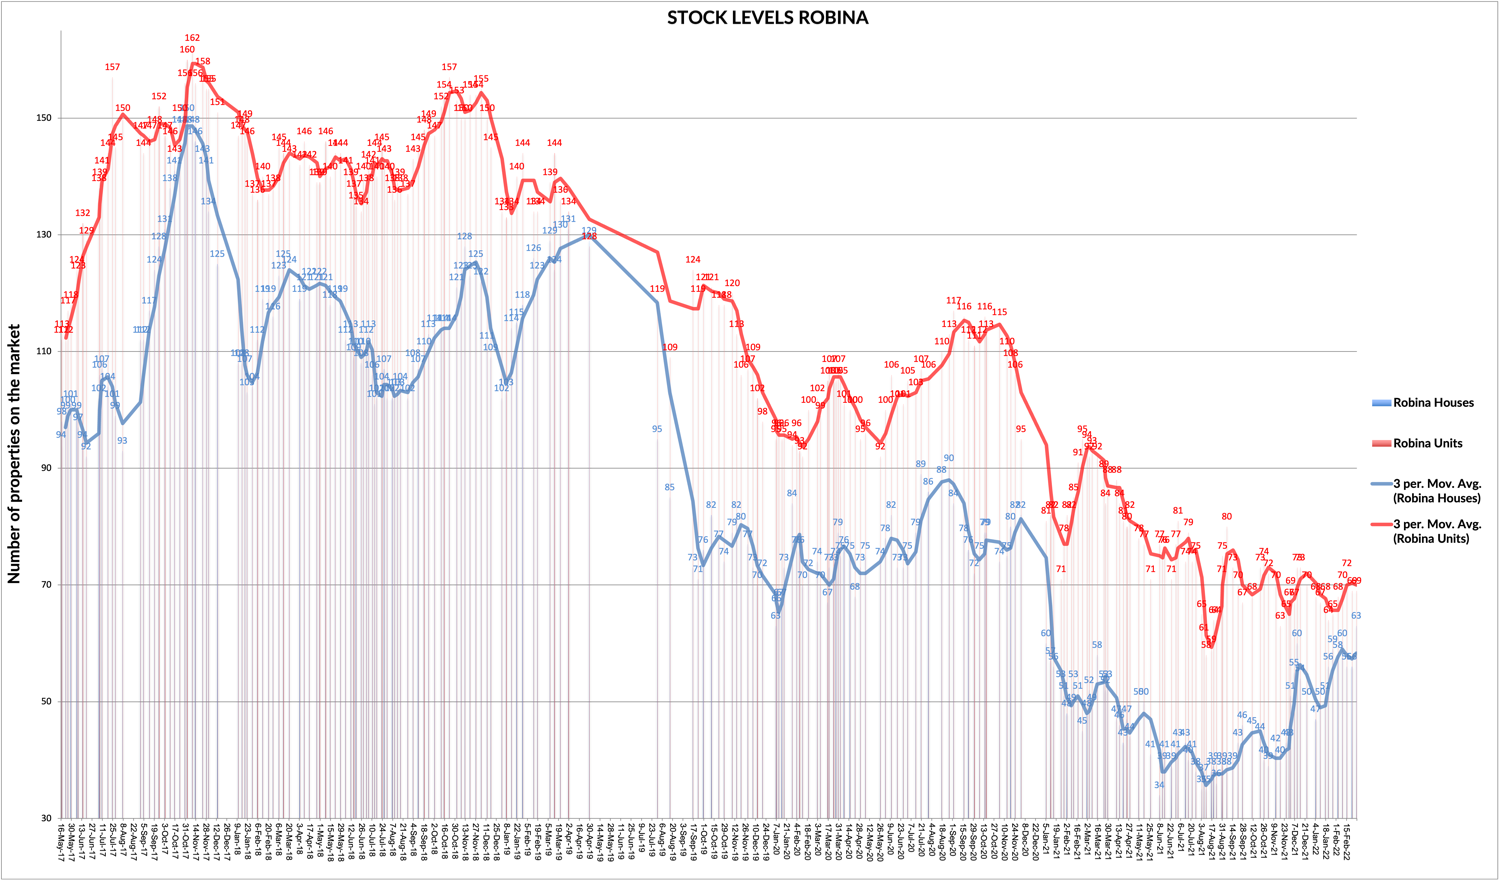

Property stock levels for houses and apartments in the Gold Coast, Queensland
Houses - Robina
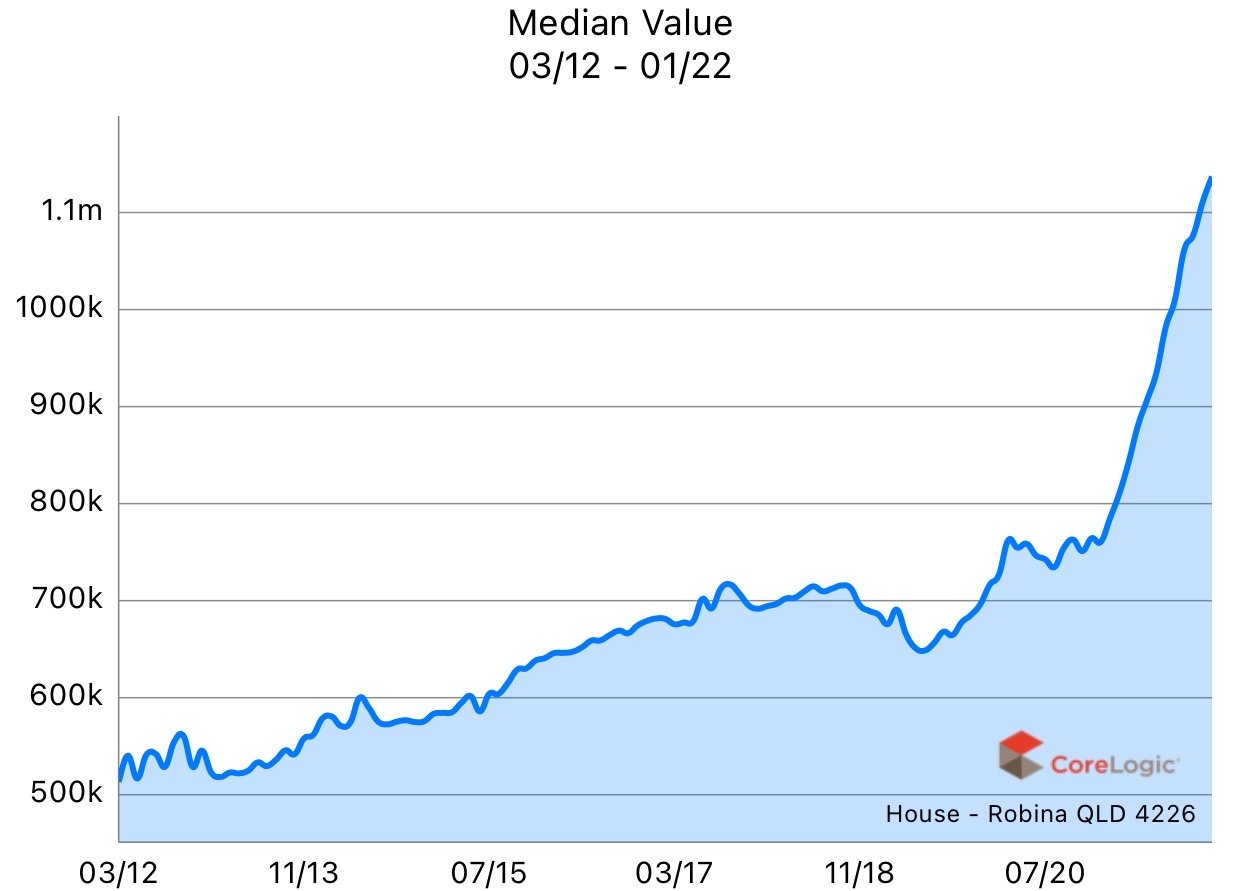
The price graphs are showing a surge in house prices in the suburb of 40.3% for the year ending in January 2022, with the average price for a home in Robina reaching $1,140,000.
I have included below a graph for the sales volume of houses in Robina, this graph illustrates that there has not been a lack of stock driving the market, but rather high demand and a very quick uptake of any stock that comes to market.


Units - Robina
The unit prices in Robina have also had a significant increase for the year ending in January 2022, with the average price increasing by 26.6% to $632,500.
The medium days on market continues to reduce significantly and stock levels remain low.
I have included below a graph for the sales volume of units in Robina, this graph illustrates that there has not been a lack of stock driving the market, but rather high demand and a very quick uptake of any stock that comes to market. Volumes are showing signs of having peaked.


Summary
The Robina and Gold Coast property market continues to perform exceptionally well with all the fundamentals driving the growth remaining consistent at the moment. Talk of high inflation rates and interest rates increasing has not impacted the local market yet.
Demand remains steady and strong. We had approximately 10 people per open home in February. This needs to be seen in the context that we used to have approximately 4 people per open home prior to 2021.
Below is a graph showing the average number of inspections per open home per month since July 2019. This graph represents the "demand" within the market.
NOTE: We have seen a significant change of buyer behaviour lately, this has translated into a relatively high number of contracts being terminated by buyers for various reasons. This seems to indicate a high level of nervousness from buyers and may signal a change in sentiment.

Average inspections per open home within Ray White Robina office till February 2022