
Real Estate Market Update - Varsity Lakes, Gold Coast QLD - June 2022
The possible slow down in the market that I eluded to in my market review 3 months ago seems to have become more evident recently. The market is definitely changing, however, it is still too early to know in which direction it will move.
Supply - Demand
Supply on the Gold Coast and in Varsity Lakes continues to be very low. House supply in Varsity reached a low in August 2021 and has been slowly increasing since. Apartment supply on the other hand continue to remain at very low levels.
Supply on the Gold Coast as a whole is steadily on the rise since it reached it lows in January 2022. The relatively low supply levels continues to support prices being achieved, however, the supply decline does seem to have bottomed out.
Demand has been dropping steadily with enquiry levels and attendance at open homes down significantly (see my summary at the end of the email).
Below are the stock level graphs for houses and units in Varsity Lakes and the Gold Coast.


Houses - Varsity Lakes
The average house price in Varsity Lakes has moved sideways for the first time in almost 2 years. It is impossible to predict where prices will move next, however, stock levels and interest rates are on the rise and demand has decreased as shown by the average number of buyers to each of our open homes.


Units - Varsity Lakes
The unit prices in Varsity Lakes continue their historic rise, reaching an average price of $675,300.
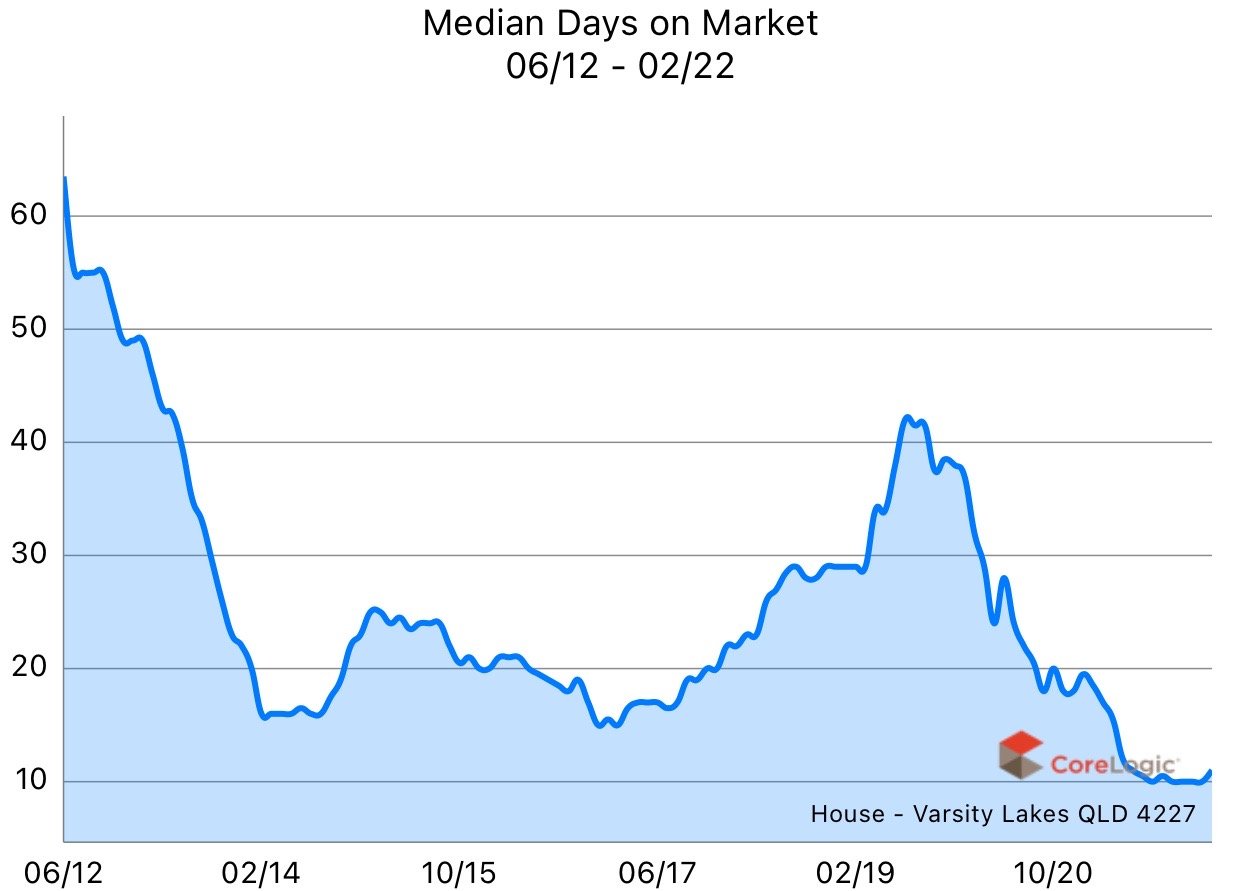
The medium days on market continues to remain low, but stock levels are on the rise.
It's hard to imagine they will continue their steep price rise with the changed market conditions, but at this stage there is not much to indicate this, other than decreased numbers at open homes.


Summary
The Varsity Lakes and Gold Coast property market continues to remain strong, but there are signs that this growth phase may be coming to an end. The increase in interest rates have put a dampener on buyer demand and sentiment and we are yet to see what the longer term implications may be.
We have had a significant decrease in the average number of buyers through each of our open homes, down from 10 in February and March, to 5 in May. This is a halving of the numbers!
Below is a graph showing the average number of inspections per open home per month since July 2019. This graph represents the "demand" within the market.

Average inspections per open home within Ray White Robina office till May 2022