Real Estate Market Update - Mudgeeraba - August 2019
With the financial year-end and elections behind us, it's a good time to look back at the performance of the property market over the past year.
We have also seen some significant changes in the market over the past month, you can see details on these in my "Summary" below.
Houses - Mudgeeraba
As can be seen from the graphs below, house prices peaked at the end of 2017 and have been moving downwards since. CoreLogic shows a drop in prices over the past year of -2.7%.
Days on market has also increased steadily since 2017, giving supporting evidence that the market has softened.
Percent stock on market has increased steadily since 2016 and does seem to have steadied recently.
Median value for houses in Mudgeeraba over the past 10 years.
Median value for houses in Mudgeeraba over the past year.
Percent stock on market for houses in Mudgeeraba, Gold Coast, Queensland
Units - Mudgeeraba
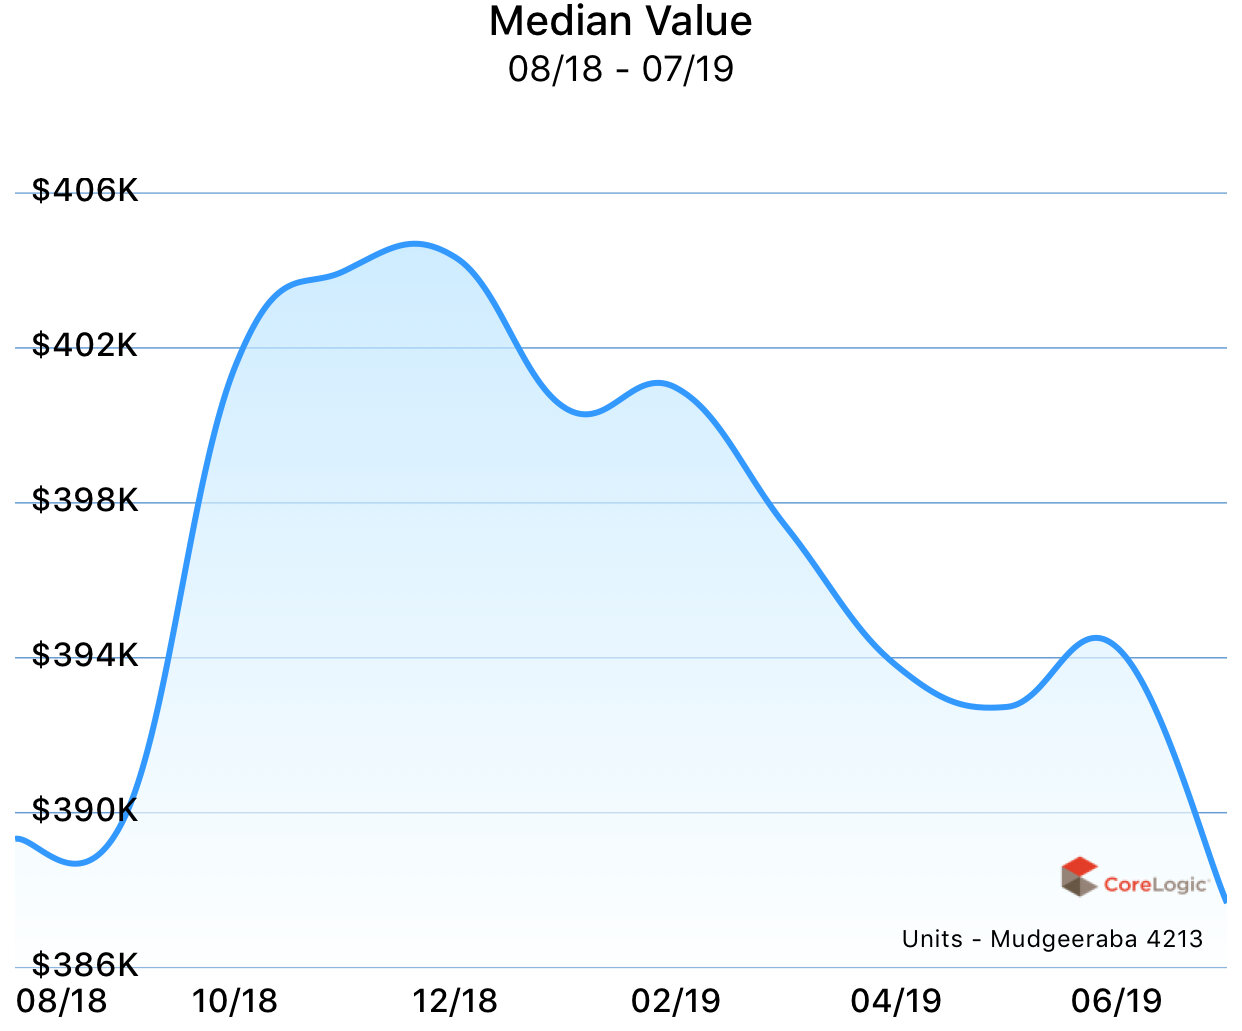
Unit prices peaked at the end of 2018 and we has moved sharply down since.
Days on market still remains historically low but has increased slightly in recent months.
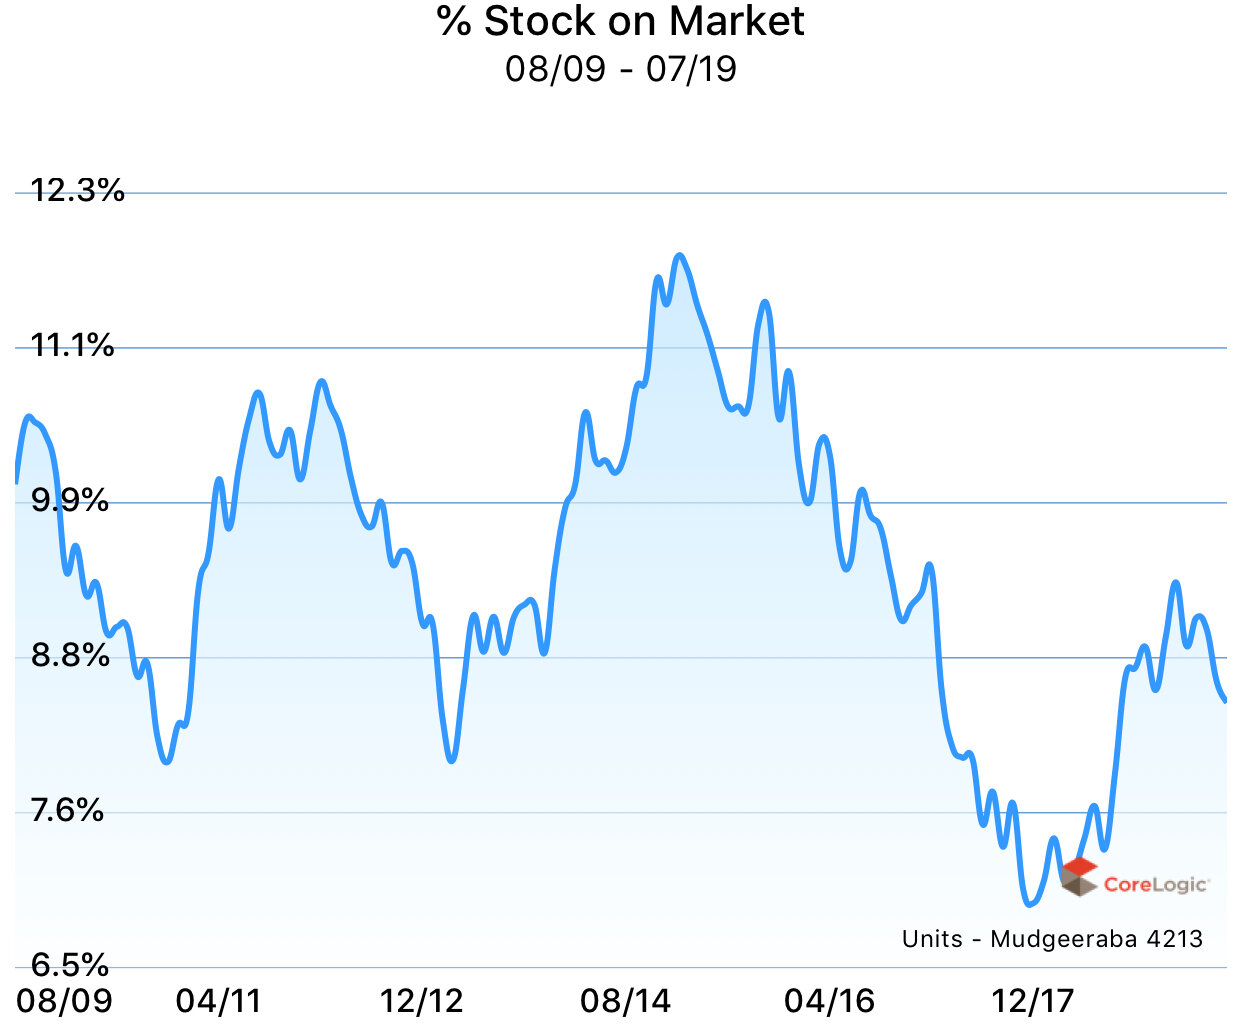
Percent stock on market peaked in February 2019 and has dropped since and hopefully this will help to support prices.
Sales statistics for units in Mudgeeraba, Gold Coast, Queensland
Median value for units in Mudhgeeraba over the past 10 years.
Median value for units in Mudgeeraba over the past year.
Median days on market for units in Mudgeeraba, Gold Coast, Queensland
Percent stock on market for units in Mudgeeraba, Gold Coast, Queensland
Summary
It is quite clear now that Mudgeeraba has been in a declining market since the beginning of 2018. This has followed the trend of the greater Gold Coast region.
Even though we haven't seen much of a drop in stock levels in Mudgeeraba, we have seen a significant reduction in stock levels across the coast and this could help to stabilise prices.
Prices could further be supported by the reduction in the assessment interest rates that the banks use to determine a clients borrowing capacity, this rate has been reduced by a significant 1.75% recently.
We have seen anecdotal evidence in our business over the past month to support that the lower stock levels and change in assessment rates have been contributing to stabilising prices. These include higher sales volumes and higher numbers through our open homes. Our average number of buyers through each open home has increased from 2.3 in May to 3.4 in July, this is a significant increase of approximately 50% in traffic at the open homes.


