Real Estate Market Update - Robina, Gold Coast QLD - December 2021
The property market on the Gold Coast continues to power ahead with no signs of slowing down at this point other than the longer term increase in interest rates charged by the bank.
Supply - Demand
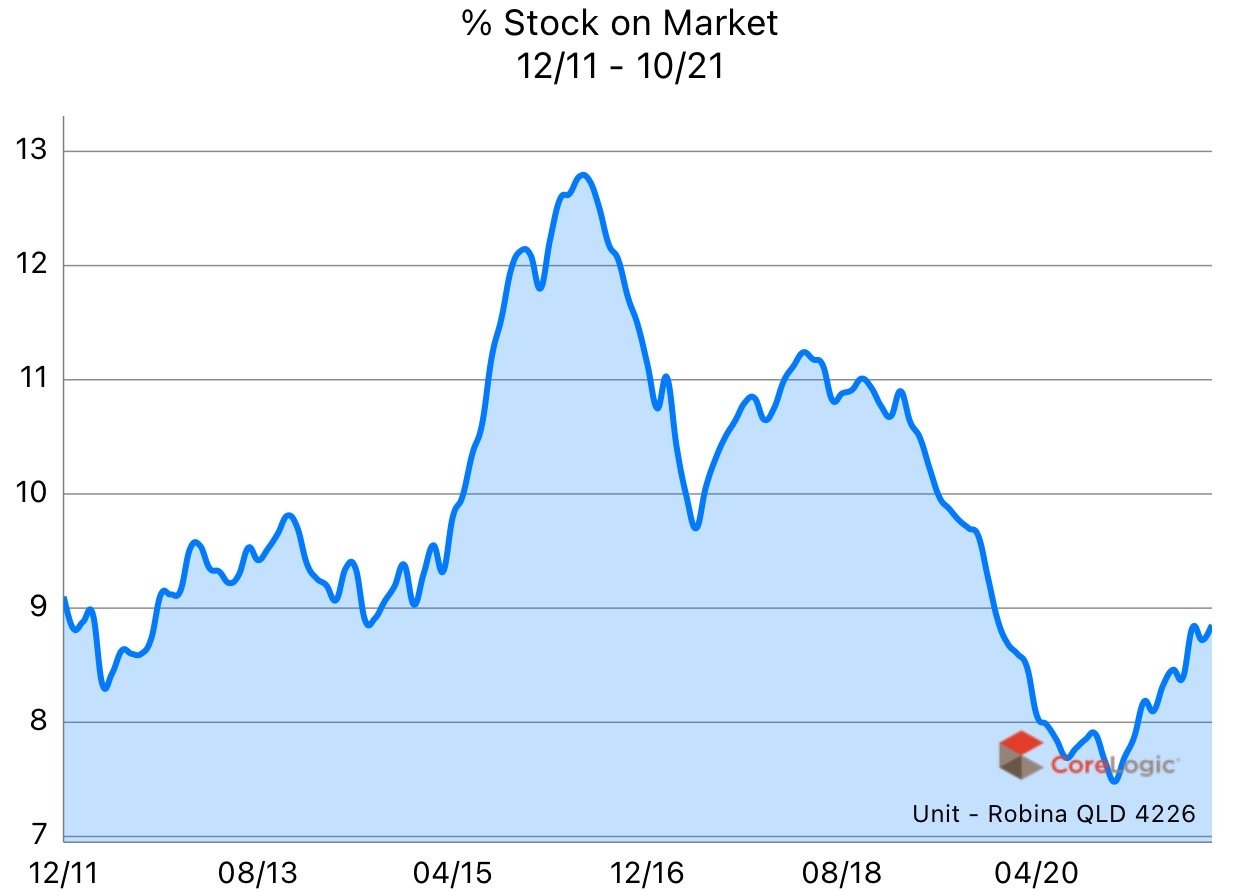
Supply on the Gold Coast and in Robina continues to be extremely low. There is a small signal in the graph that supply may be levelling off, however, it is still too early to read into this. The low supply levels continues to put an upward pressure on prices.
Demand remains strong, with very large numbers of enquiries for most properties brought to market and consistently large numbers through our open homes ( see my summary at the end of the email ).
Below are the stock level graphs for houses and units in Robina and the Gold Coast.
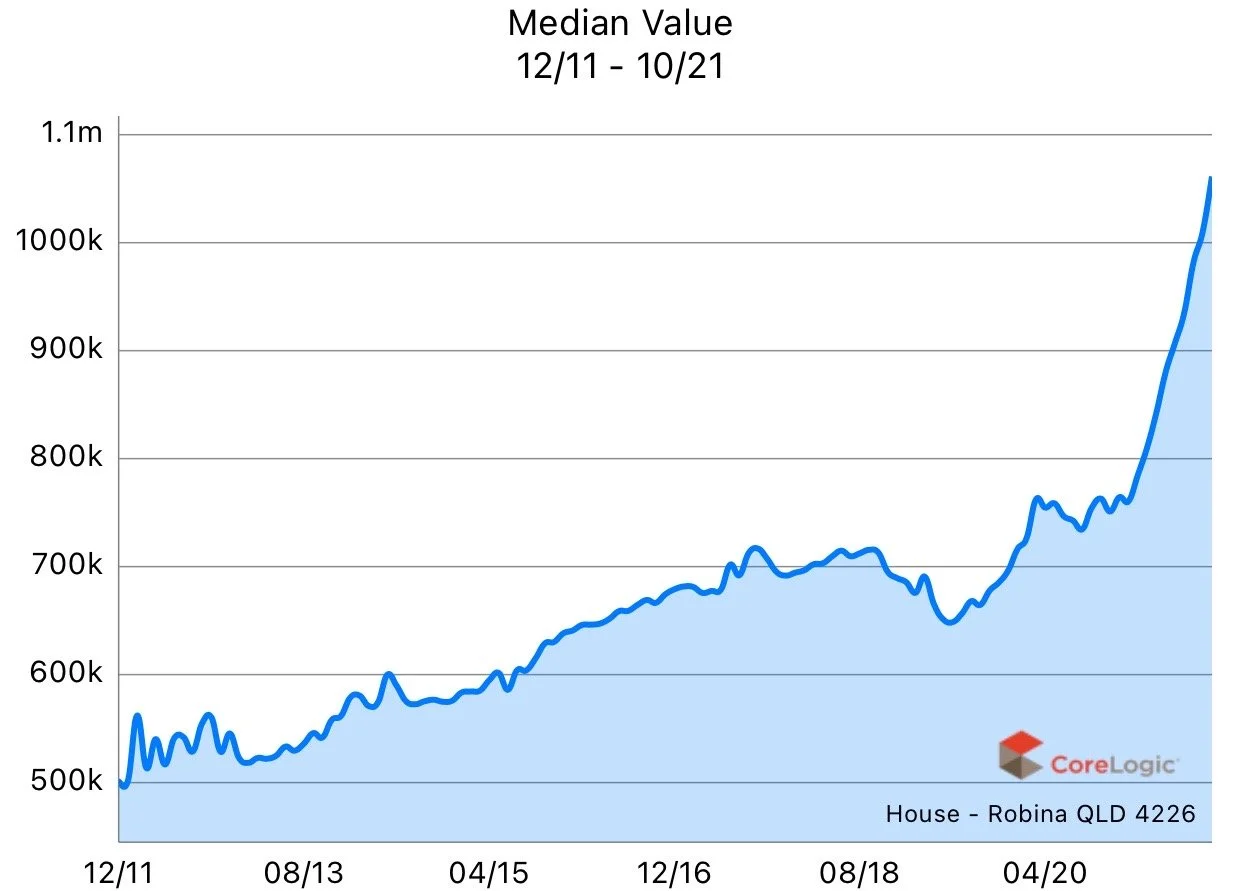
Houses - Robina
The price graphs are showing a surge in house prices in the suburb of 39% for the year ending in October 2021, with the average price for a home in Robina reaching $1,060,000 in October.
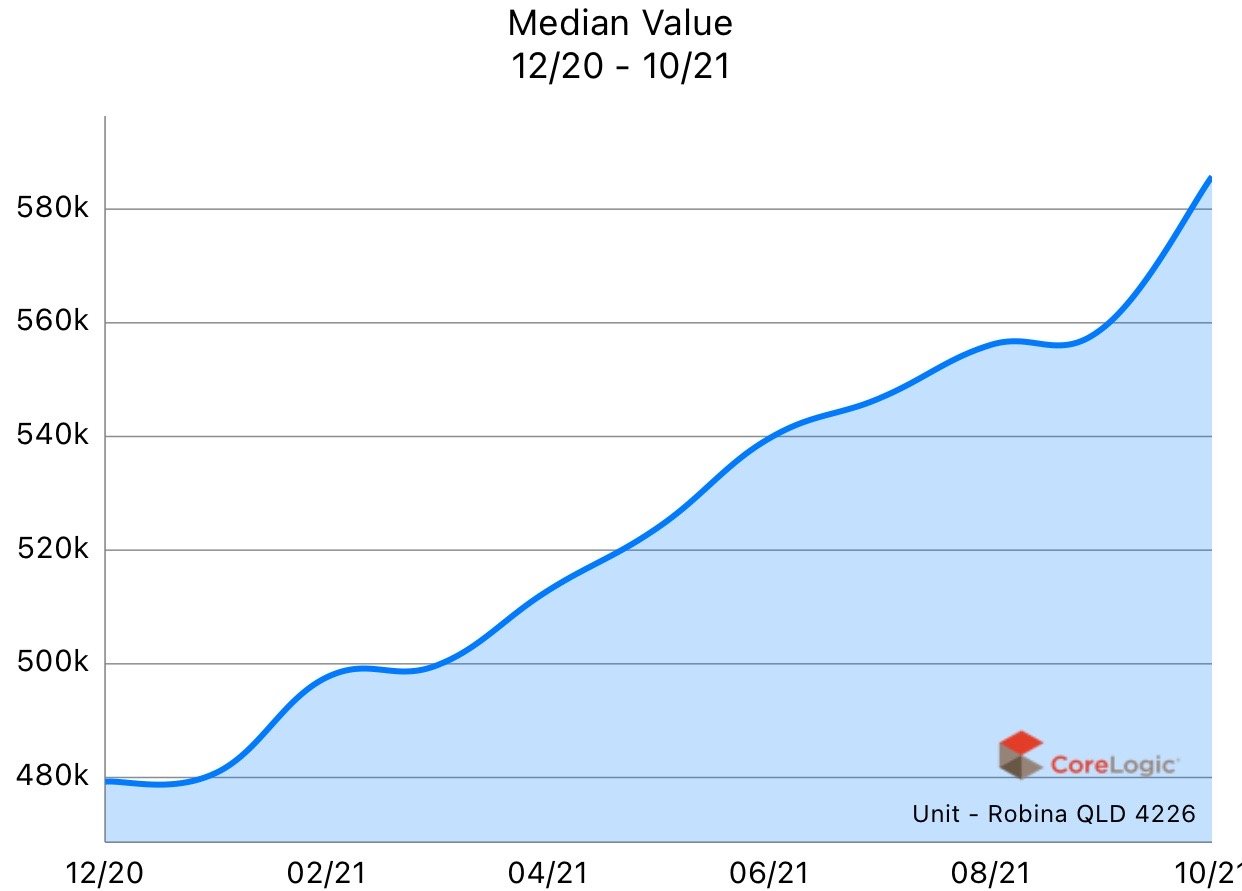
Units - Robina
The unit prices in Robina have also had a significant increase for the year ending in October 2021, with the average price increasing by 22% to $585,000.
The medium days on market has also reduced significantly and stock levels remain low.
Summary
The Robina and Gold Coast property market continues to perform exceptionally well with all the fundamentals driving the growth remaining consistent at the moment.
Demand remains steady and strong, with only a slight dip since the highs in July, where we were seeing on average 12 people per open home. We had approximately 9 people per open home in November. This needs to be seen in the context that we used to have approximately 4 people per open home prior to 2021.
Below is a graph showing the average number of inspections per open home per month since July 2019. This graph represents the "demand" within the market.


