
Real Estate Market Update - Robina, Gold Coast QLD - August 2021
Two months ago I wrote that most property owners are asking the question "when will it come to an end?", with regards to the rising market and at the moment it is still showing no signs of slowing.
Supply - Demand
Supply on the Gold Coast and in Robina has been extremely low in preceding months and has continued to fall in the last couple of months which continues to put an upward pressure on prices.
Demand remains strong, with very large numbers of enquiries for most properties brought to market and ever increasing numbers through our open homes ( see my summary at the end of the email ).
Below are the stock level graphs for houses and units in Robina and the Gold Coast.


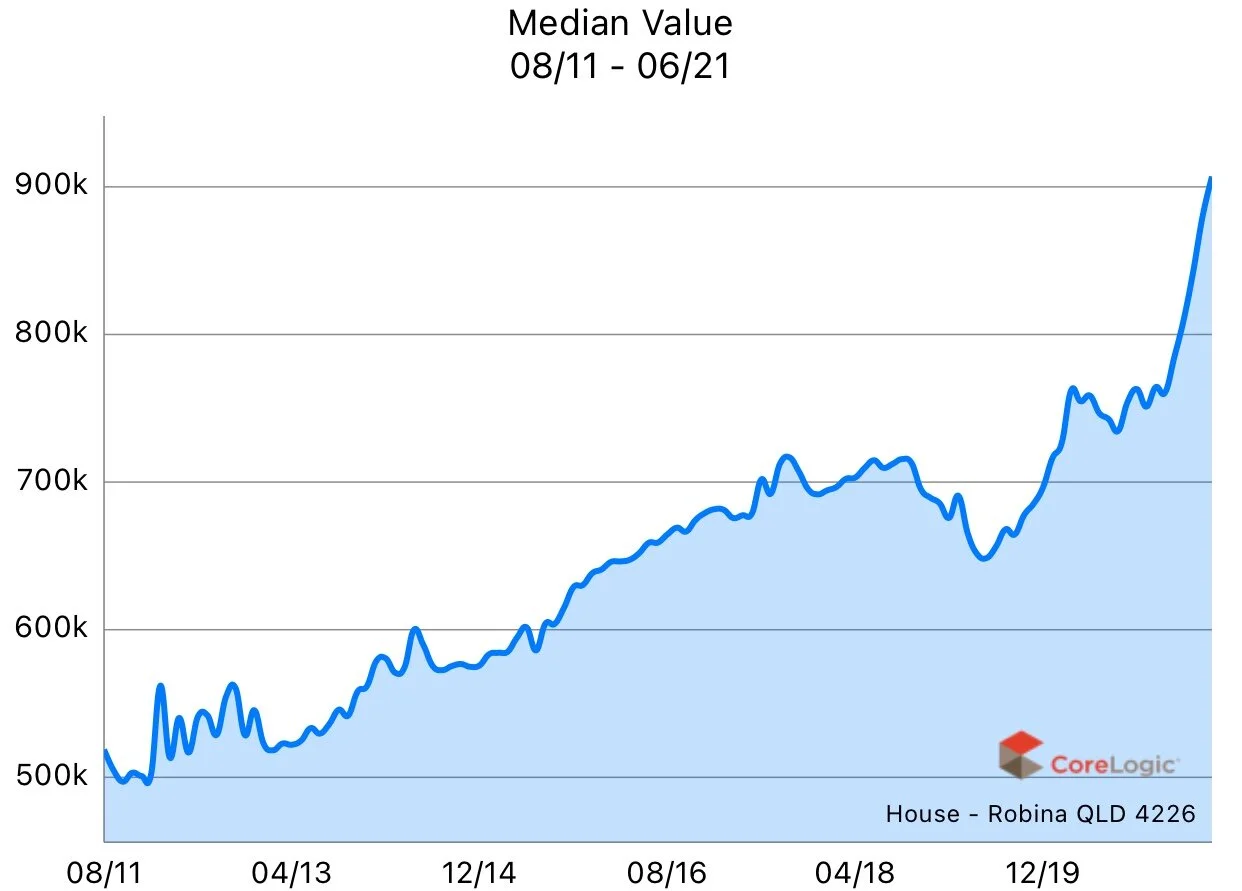
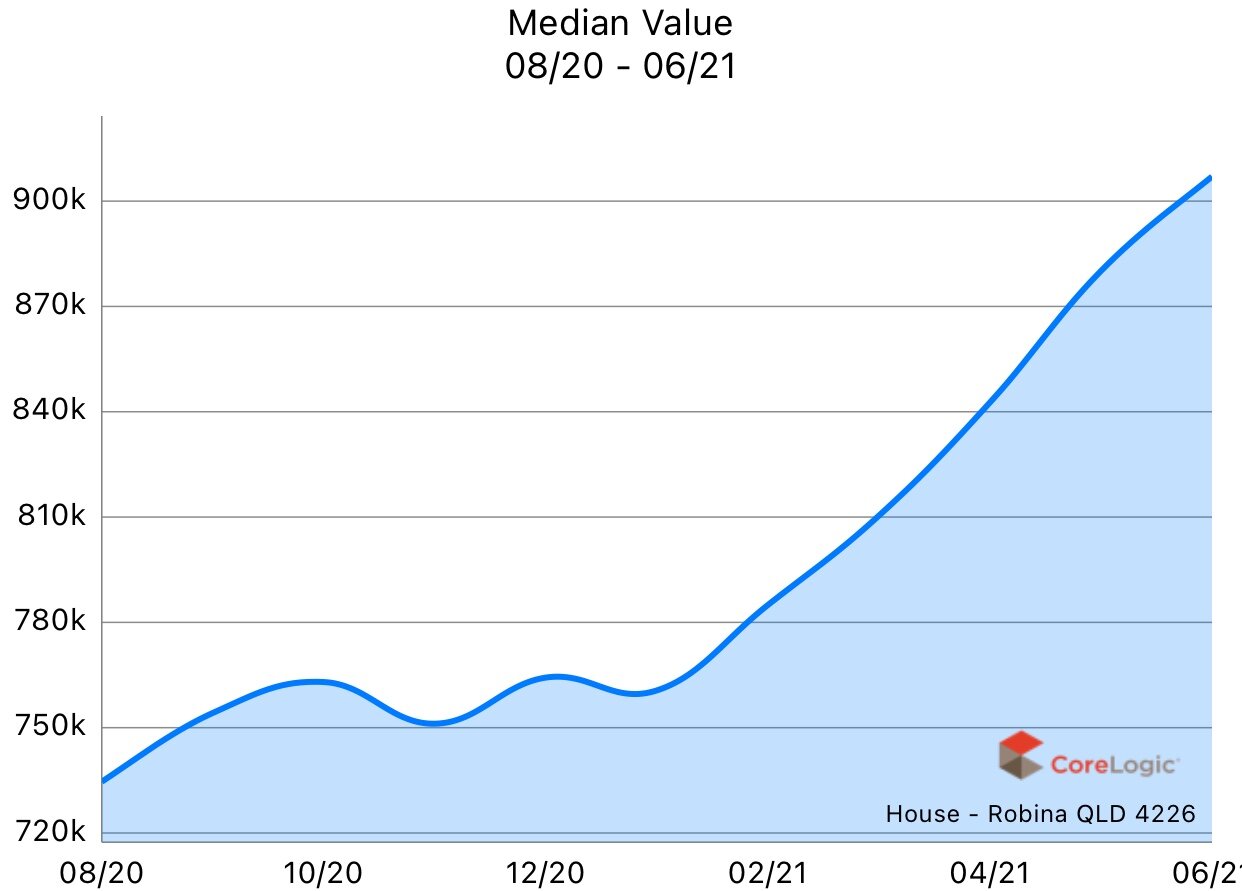
Houses - Robina
The stock levels of houses continue to drop in the suburb and high sale prices continue to be achieved. The growing number of buyers compete for the decreasing number of homes on the market.


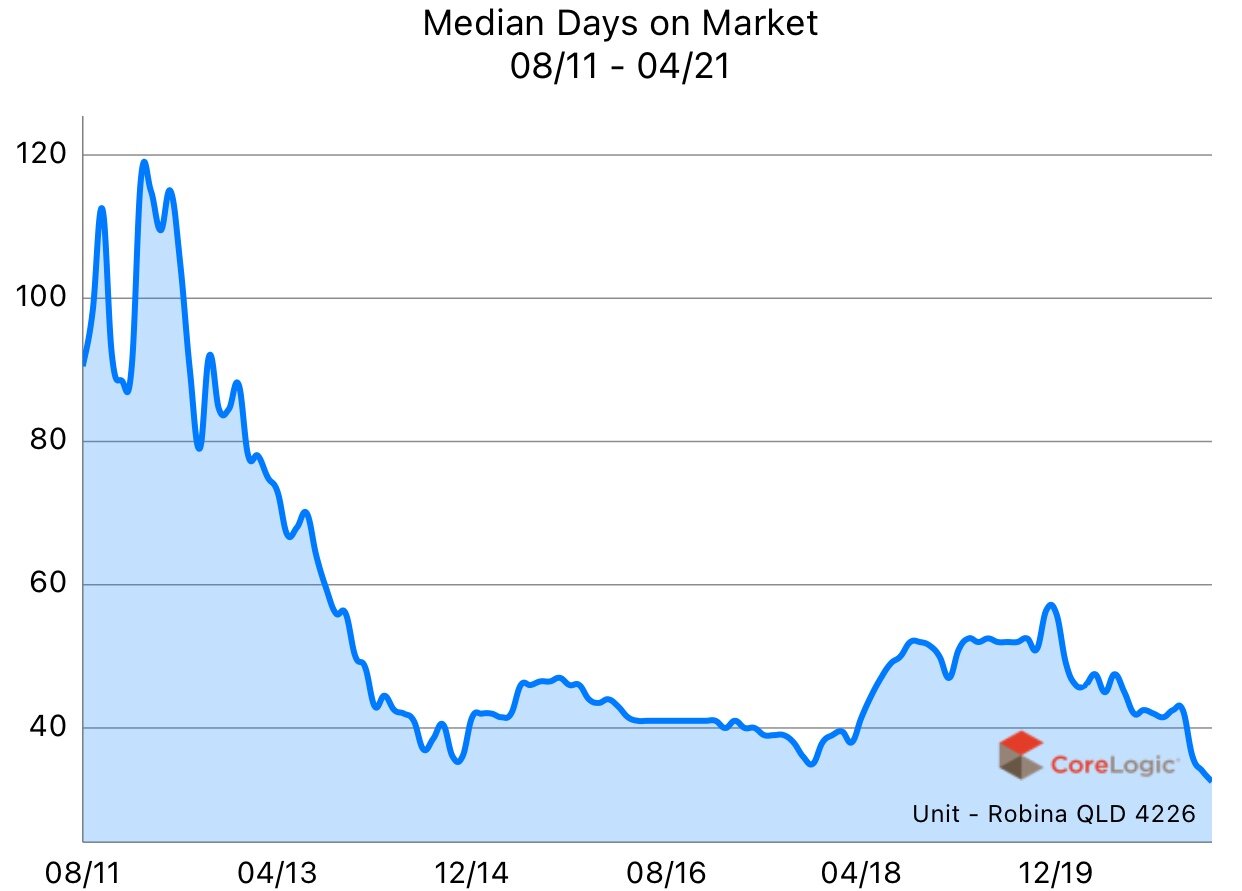
Units - Robina
The number of units on the market in Robina has dropped significantly over the past couple of months and this is being reflected in the continued increase in prices being achieved.
Stock numbers has also had a significant decrease in the past two months.


Summary
The Robina and Gold Coast property market has been performing exceptionally well and all the fundamentals driving this growth have strengthened even further over the past 2 months since my last market review.
Demand has increased in June and July with the average number of people through each of the open homes held by our office going up from 9 to above 12. This will certainly be putting an upwards pressure on price.
Below is a graph showing the average number of inspections per open home per month since July 2019. This graph represents the "demand" within the market, which at the moment seems to be on an upwards trend.
