Real Estate Market Update - Robina, Gold Coast QLD - June 2021
All the veteran agents in our office are saying that they have never seen a market like this. The big question most people are asking is "when will it come to an end?".
I don't have a crystal ball, but I do have the numbers and information below which explains what is driving the market and the situation at present.
Supply - Demand
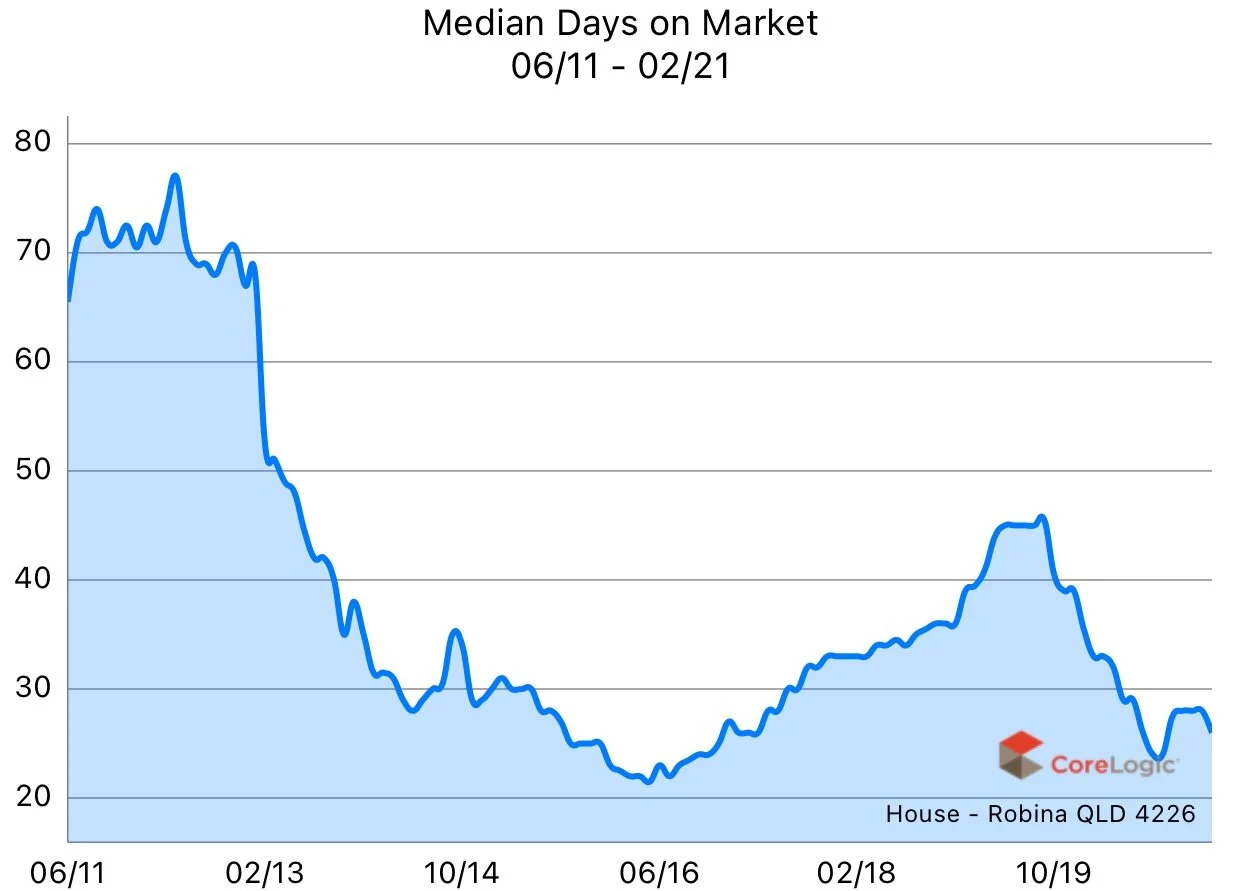
As always, it is supply and demand that govern prices. Supply on the Gold Coast and in Robina has been and still is extremely low. This has been one of the major factors driving the rise in property prices.
Demand also remains strong, with very large numbers of enquiries for most properties brought to market and good numbers through our open homes ( see my summary at the end of the email ).
Below are the stock level graphs for houses and units in Robina and the Gold Coast.
Houses - Robina
It is clearly evident from the graphs above that stock levels in Robina are at significant lows and are showing no signs of increasing. This lack of stock is creating an environment in which buyers are competing for limited stock and has resulted in most properties selling with multiple offers and driving prices higher.
Whether it will be an increase in stock or a decrease in demand that will slow the price growth is yet to be seen. At the moment neither are occurring and there is good support for the high prices currently being achieved.
Units - Robina
After many years of being in the doldrums, unit prices are finally rising and the increase has been quite substantial (approximately 14% in the past year as seen below).
Once again it is very low stock levels driving the market.
Summary
The Robina and Gold Coast property market has been performing exceptionally well and all the fundamentals driving this growth are still present in the current market.
It is my opinion that prices are still being supported by very low stock levels and low interest rates enabling more buyers to enter the market. Interstate migration is also helping to keep demand levels high.
Demand has in fact increased in April with an average of 9 people through each of the 118 open homes held by our office. To put this into perspective, since July 2019 the lowest average number was 3.61.
Below is a graph showing the average number of inspections per open home per month since July 2019. This graph represents the "demand" within the market, which at the moment shows no sign of slowing.


